

Integrating SAP with Power BI: A CFO's Guide to Real-Time Financial Intelligence in India
By BiPivot Team · 9 August 2026
Why Are So Many Indian CFOs Still Waiting Three Days for a P&L?
SAP serves over 15,000 customers in India, and 80% of these are small and mid-sized businesses just like yours (Analytics India Mag). Collectively, SAP systems process 60% of India's GDP (Business Standard). Yet ask any finance head at a ₹300-500 crore manufacturing or trading company how long it takes to get a consolidated, multi-entity P&L out of SAP, and the honest answer is usually "two to three days, and then we still fix it in Excel."
That gap — between the sheer scale of SAP's footprint in India and the sluggishness of standard SAP reporting — is where Power BI earns its keep. This isn't a software feature story. It's a story about what it costs a mid-sized Indian company when the CFO's dashboard is three days stale, and what changes when it isn't.
What Does "Integrating SAP with Power BI" Actually Mean for a Finance Team?
In plain terms: instead of running twelve separate SAP transaction codes (FBL3N, MB5B, VF05, S_ALR_87012993, and so on) and stitching the exports together in Excel every month-end, you connect Power BI directly to SAP's underlying tables or extractors, build a data model once, and refresh it on a schedule — or near-live, enabling real-time or near real-time visibility into SAP data for faster and improved decision-making (Snak Consultancy).
Concretely, this means:
- FI (Finance) data — GL postings, AR/AP ageing, TDS ledgers — flows into a single financial model instead of six export files.
- CO (Controlling) — cost centre and profit centre actuals vs. budget — sits next to FI data in the same visual, not a separate report cycle.
- SD (Sales) and MM (Materials Management) — order-to-cash and procure-to-pay volumes — get layered on top, so a CFO can see margin erosion by product line the same week it happens, not the month after.
- HR headcount and cost data can sit in the same workbook as P&L data for cost-per-employee tracking.
Power BI is built for exactly this kind of blending — it unifies FI, CO, SD, MM and HR data from SAP, and can layer in external sources like CRM exports, HR systems or plain Excel files that Indian finance teams still maintain for statutory workings (Pristine Solutia). For a company running SAP alongside a separate payroll tool, a bank's cash management portal, and a GST filing utility, that blending capability is the whole point — one number, reconciled once, not four spreadsheets reconciled never.
If you haven't yet mapped out where Power BI fits in your broader finance stack — alongside your ERP, GST tools and treasury systems — our modern finance tech stack guide is a useful starting reference before you commit budget to this integration.
What Does This Actually Save on the P&L?
Let's do the arithmetic a CFO would want before signing off a project.
Reporting license costs: Migrating reporting users off legacy BI tools onto Power BI leads to more cost-effective reporting, reducing reliance on expensive SAP reporting licenses and offering a potentially lower overall Total Cost of Ownership (TCO) compared to legacy BI systems, as evidenced in practice for companies with sprawling BusinessObjects estates (SPEC INDIA).
Manual reporting effort: Take a company with three plants and one head office, closing books monthly. A controller's team spending 3 days x 2 people on extracting SAP data, reconciling it in Excel, and formatting slides for the CFO review — that's roughly 48 person-hours a month, or close to 580 hours a year. At a fully loaded cost of ₹700/hour for a mid-level finance analyst, that's over ₹4 lakh a year in labour spent purely on data wrangling, before any actual analysis happens. Manual SAP data extraction and manipulation is consistently flagged as the highest-effort, highest-error step in the reporting cycle (UBTI Inc.) — and it's the first thing that disappears once refreshes are automated.
The compounding cost of delay. If your receivables dashboard is three days behind, a customer who's slipped past their credit limit keeps shipping for three more days. On an average order value of ₹8 lakh for a mid-sized distributor, that's a real, bookable exposure created purely by reporting lag — not by any commercial decision.
None of this counts the softer win: a CFO who can walk into a board meeting with a live dashboard instead of a static PDF built two days ago earns a different kind of credibility.
How Do You Keep GST, TDS and MCA Compliance Accurate When Data Moves This Fast?

This is where Indian CFOs should be more demanding than the average global case study, because compliance risk in India isn't abstract — it's a monthly GSTR-1/3B cycle, a quarterly TDS return, and MCA filings that don't forgive sloppy reconciliation.
For Indian SMEs, SAP Business One is designed to handle India-specific GST structures, including CGST, SGST, IGST, CESS, TDS, and TCS, and supports integration with authorized GST service providers for e-invoicing and e-way bill generation (Panfish). The data is there and it's correct at source. The problem is almost never SAP's tax logic — it's what happens when someone re-keys that data into a return-filing tool or a board pack and a decimal shifts.
A Power BI layer sitting directly on SAP's tax tables closes that gap in three concrete ways:
- GSTR-2B vs. purchase register reconciliation becomes a refreshed dashboard instead of a monthly VLOOKUP exercise — you see mismatched vendor invoices the day they appear, not at filing deadline.
- TDS threshold tracking across vendors — Section 194C, 194J, 194Q watch-outs — can be flagged visually the moment a vendor crosses a cumulative payment threshold within the year, instead of being caught during a year-end TDS audit.
- Sales register accuracy for GSTR-1 improves because the same underlying SD/FI data feeding your Power BI sales dashboard is what should be filed — no separate extract, no separate error.
The net effect: audit readiness improves not because you've added another compliance tool, but because everyone — auditors included — is looking at the same live number instead of three versions of a spreadsheet with different "final" tags.
Why Do SAP-to-Power BI Projects Stall or Underdeliver?
Here's the part that vendor blogs gloss over. A survey indicated that 84% of companies have a Power BI adoption rate of less than 50%, highlighting a common challenge in maximizing ROI (Collectiv). That's not a Power BI problem; it's usually a data modeling problem inherited from SAP.
Three failure patterns show up repeatedly in Indian mid-market implementations:
1. Treating SAP's tables like a spreadsheet. SAP's data structures are deeply normalized — a single "sales figure" might be split across VBAK, VBAP, and pricing condition tables. Pulling these directly into Power BI without proper modeling produces dashboards that are technically connected but practically wrong — double-counted line items, missing tax splits, mismatched currency conversions. Correct modeling genuinely requires people who understand SAP's data structure, not just Power BI's DAX language, due to the complex and often normalized data structures within SAP (Abbacus Tech).
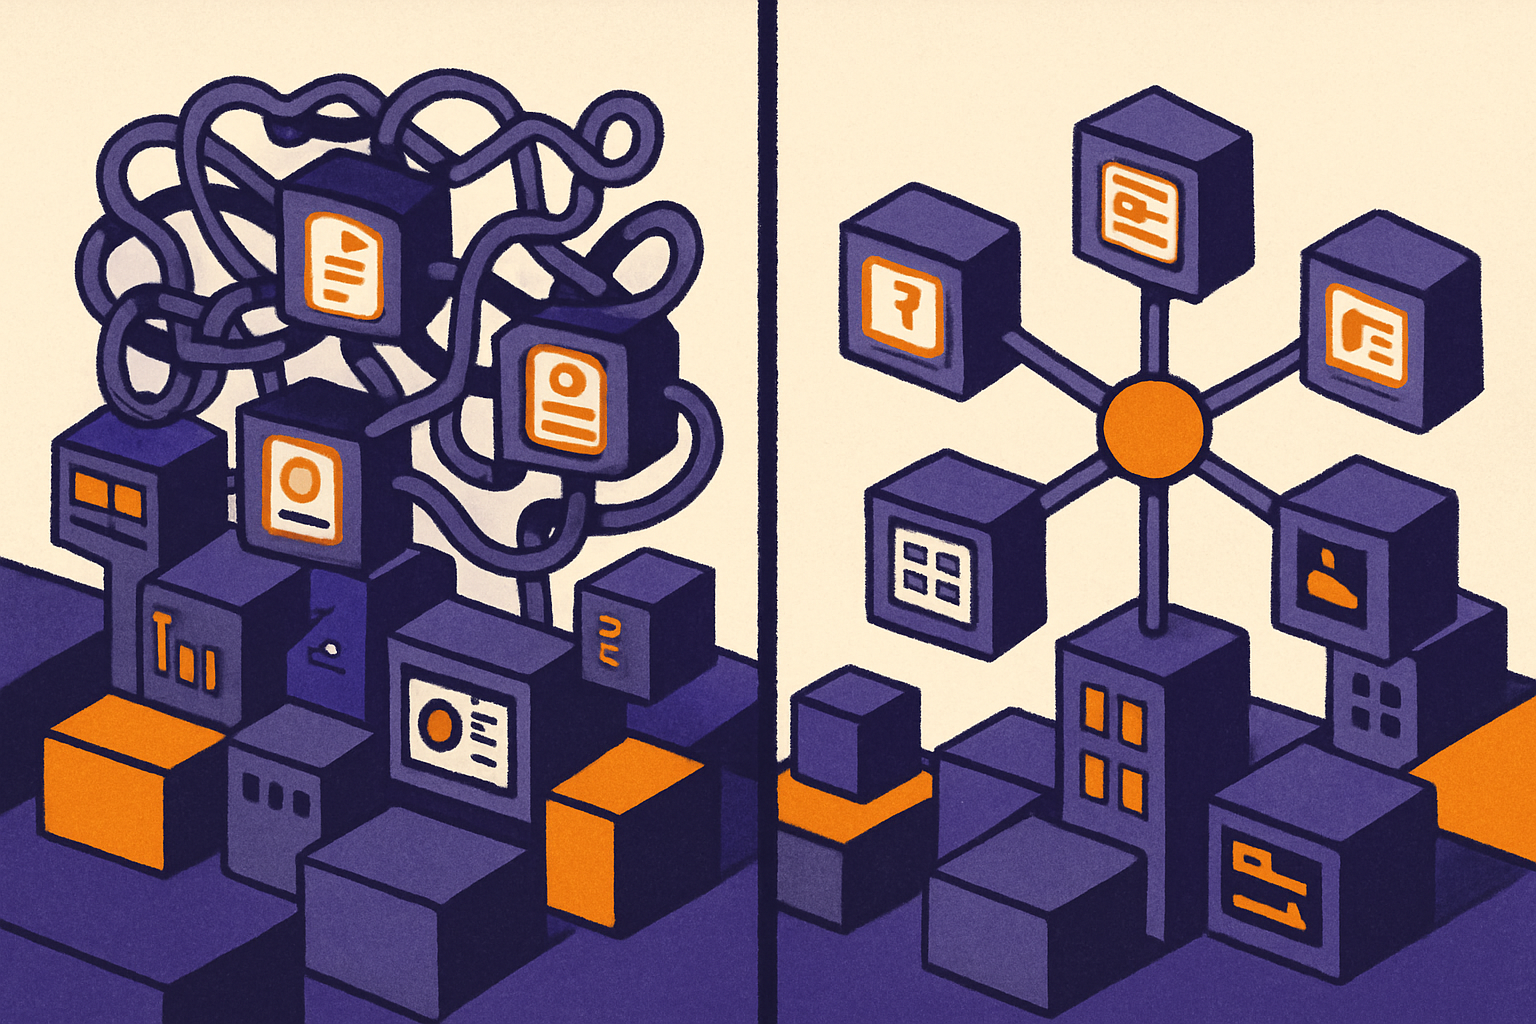
The fix is not clever DAX — it's an intermediate layer. Build a set of clean, denormalized extract views (either in SAP via CDS views, or in a staging database) that already resolve the joins finance actually needs — GL account against cost centre against profit centre against tax code — before Power BI ever touches the data. Model once, correctly, and every dashboard built afterward inherits that correctness.
2. Pulling everything live and wondering why it's slow. A DirectQuery connection pulling five years of transactional line items straight from a production SAP instance every time someone opens a dashboard will visibly lag, and worse, it competes with SAP's own transactional performance during business hours. Performance issues, including latency in live connections, can occur when pulling large volumes of transactional data from SAP into Power BI, requiring optimization (Edureka).
The practical answer for most finance reporting: scheduled imports (hourly or nightly) for historical and month-end data, live connections reserved only for the handful of metrics — cash position, today's collections — that genuinely need to be current to the minute.
3. No one owns data security in the handoff. The moment financial data leaves SAP's role-based authorization model and lands in a Power BI workspace, you need an equivalent access model rebuilt — otherwise a junior analyst with a Power BI license can see salary data or vendor payment terms they'd never have SAP authorization to view. Protecting sensitive ERP data during transfer and ensuring compliance with SAP security policies are significant data security and governance concerns (uptime-erp.de).
Row-level security in Power BI, mapped explicitly against SAP authorization groups, needs to be a design requirement from day one — not a retrofit after the CFO notices something they shouldn't have seen in a shared dashboard.
What Should a CFO's First 90-Day Rollout Actually Look Like?
Skip the "connect everything" instinct. A phased rollout that a mid-sized company can realistically execute:
Days 1-20 — Scope one reporting pain, not the whole ERP. Pick the report that currently causes the most monthly pain — usually the consolidated MIS pack or the cash position report. Document exactly which SAP tables/transactions feed it today and who touches the data manually in between.
Days 21-45 — Build the extraction and modeling layer. Work with someone who knows both SAP's table structure and Power BI's modeling requirements (star schema, not a flat mirror of SAP tables) to build clean, reusable views. This is the step companies most often try to skip and most often regret skipping.
Days 46-65 — Build the dashboard and validate against the manual process. Run the new dashboard in parallel with the existing manual report for at least one full month-end close. Every number must tie back exactly — no "close enough." This is also where you design row-level security against your SAP authorization roles.
Days 66-90 — Roll out to a pilot group, then expand. Start with 5-8 users — CFO, controller, 2-3 business unit finance leads. Gather what they actually click on versus what you assumed they'd want. Expand access module by module (finance first, then sales, then procurement) rather than a big-bang rollout across the whole finance team.
If your dashboards are going to double as the primary MIS pack the board and lenders see, it's worth reading our companion piece on MIS reporting best practices for Power BI dashboards CFOs actually trust — it goes deeper into layout, drill-through design and what makes a dashboard credible to a banker versus merely pretty.
What's the Real Cost of Staying on Stale SAP Reports?

Consider a mid-sized auto-components exporter we'll call the pattern for (a composite drawn from common situations, not a single named client): monthly close on the 5th working day, GST filing pressure in the same week, and a working capital position that swings hard because 60% of sales are export-linked with variable realization timing.
Under the manual-SAP-export model, the CFO sees collections data that's 2-3 days old by the time it's compiled. A large receivable slips past its due date on day 1; it isn't flagged until the ageing report is rebuilt on day 4. By then, the sales team has already released the next shipment against that same customer's credit limit — because nobody flagged the breach in time. That's not a hypothetical; it's the default outcome of a reporting cycle slower than the business cycle it's meant to monitor.
With a live-refreshed Power BI dashboard sitting on SAP's AR ledger, that same breach is visible the morning it happens. The credit control team holds the next shipment release for review instead of automatically approving it. Over a year, avoiding even two or three such slippages on ₹8-10 lakh orders is worth more than the entire cost of the integration project.
This is the same logic that underpins a properly designed cash flow dashboard — timing visibility is the entire value proposition, not a nice-to-have. If working capital and cash timing are your primary pain point rather than general MIS, our cash flow dashboard blueprint and working capital dashboard build guide go deeper on that specific build than this article does.
Is Power BI-on-SAP Actually Gaining Ground in India, or Is This Hype?
The adoption numbers suggest this is now mainstream infrastructure, not an experiment. Power BI holds over 30% global market share among analytics and BI platforms (Electrifying IQ), and more than 30 million users access the platform monthly worldwide (Power BI Training Hyderabad). In India specifically, around 50% of businesses, particularly SMEs, have adopted cloud-based BI tools due to their scalability and lower upfront costs (Precision Reports).
There's also a forward-looking angle Indian CFOs should note: 96% of Indian midmarket organizations are already prioritizing generative AI (SAP News). Power BI's Copilot and natural-language query features sit directly on top of the same SAP-fed data model discussed in this article — meaning the integration work you do now to get clean SAP data into Power BI is also the prerequisite for any AI-assisted finance analytics you plan to adopt in the next 12-18 months. Companies that treat this as a data-plumbing investment now avoid rebuilding it later when the AI layer becomes non-negotiable.
How Does This Integration Fit into a Broader Data-Driven Finance Function?
Integrating SAP with Power BI is not, by itself, a data strategy — it's one important pipe in a larger system that should also include clean vendor and bank data, automated reconciliations, and disciplined access controls. If SAP-Power BI integration is your first serious step toward a genuinely data-driven finance function, it's worth reading it alongside our broader piece on how CFOs build a data-driven finance function, which frames where this integration sits relative to reconciliation automation, vendor data (vendor reconciliation), bank data (bank reconciliation) and procurement data (P2P automation) — because a dashboard is only as trustworthy as the reconciled data feeding it.
How Can BiPivot Assist with SAP-Power BI Integration?
BiPivot works with mid-sized Indian finance teams to design the SAP data-extraction layer correctly the first time — clean views, proper row-level security mapped to SAP authorizations, and dashboards validated against your actual month-end close before rollout. If you're weighing whether to build this in-house or bring in SAP-and-Power BI expertise together, explore our consulting approach or browse our tools to see how we think about finance data pipelines end to end.