

Cash Flow Dashboard Design: A CFO's Blueprint for Mid-Sized Indian Companies
By BiPivot Team · 31 July 2026
Every mid-sized Indian company we've worked with has a cash flow statement. Almost none of them have a cash flow dashboard that a CFO can open on a Tuesday afternoon and know, within ninety seconds, whether the company can honour Friday's vendor payments, this month's TDS deposit, and next quarter's capex — without calling three people first.
That gap — between having the numbers and having the insight — is what this article is about. Not how to drag a visual onto a Power BI canvas, but how to design a cash flow dashboard that actually reflects how cash moves (and gets stuck) in an Indian business: GST credits sitting in limbo, TDS locking up money before it even lands in your account, customers treating net-60 as a suggestion, and MCA quietly changing the disclosure rules under your feet.
Why isn't a monthly cash flow statement enough anymore?
Because by the time it's compiled, it's already history. Spreadsheet-based financial reporting in Indian mid-sized companies typically runs on data that is 15–25 days old by the time it reaches decision-makers, manually assembled and prone to error — which is exactly why finance teams end up reacting to problems instead of preventing them (fireai.in/blog/ca-cfo-dashboards-vs-spreadsheets). A cash flow statement prepared on the 10th of the month, for the month that ended on the 30th, tells you what happened. It doesn't tell you that ₹42 lakh of receivables are about to cross 90 days, or that your GST refund of ₹18 lakh has been stuck in processing for six weeks.
This is precisely the shift Indian CFOs have been forced into over the last few years — from historical scorekeeper to forward-looking business partner, a transition that real-time financial dashboards have made possible (myndsolutions.com/blog/real-time-financial-dashboards-indian-cfos). Real-time dashboards give instant visibility into cash flow, working capital, compliance status and margins, letting CFOs make agile, data-backed calls instead of end-of-month autopsies (myndsolutions.com/blog/real-time-financial-dashboards-indian-cfos).
If your finance function is still stitching together bank statements, Tally exports, and a GST reconciliation sheet every Monday morning, you're not managing cash flow — you're archaeologizing it. We've written separately about why Excel alone is no longer enough for reporting generally; cash flow is simply the sharpest edge of that problem, because unlike a P&L, a cash crunch doesn't wait for month-end to hurt you.
What should a cash flow dashboard actually show a CFO?
Strip away the vanity metrics. A cash flow dashboard built for decision-making — not for board-meeting decoration — needs four layers, each answering a different question a CFO asks at a different time of day.
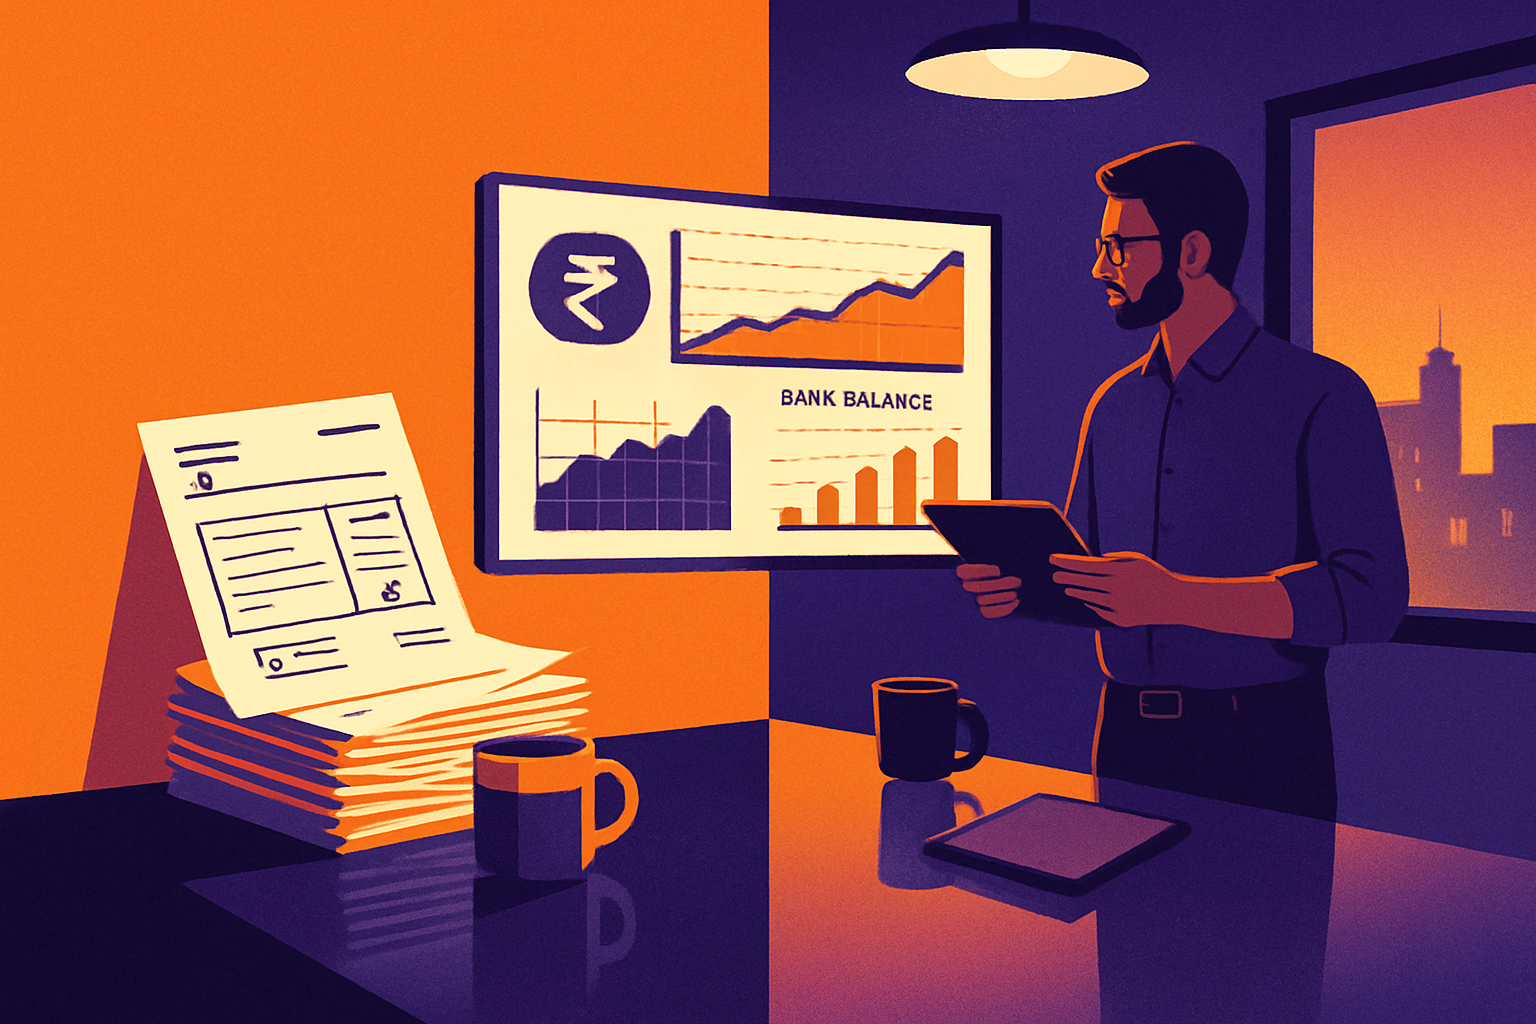
1. Today's liquidity position. Consolidated bank balances across all accounts (current, cash credit, overdraft), updated at least daily via bank feed or API, not manually keyed from a passbook. This is your "can we pay?" number.
2. The 13-week rolling forecast. Not a 12-month plan — a 13-week view, refreshed weekly, that shows expected inflows (collections by customer, GST refunds due, loan disbursements) against committed outflows (vendor payments, salaries, TDS/GST deposits, loan EMIs). This is where most Indian mid-market dashboards fail: they show history beautifully and forecast nothing.
3. Working capital drivers. DSO, DPO, DIO, and the cash conversion cycle, broken by customer/vendor segment. We've built out the mechanics of this in detail in our working capital dashboard build guide — if you haven't set up that layer yet, do that before layering on the compliance and forecasting views described here.
4. Compliance-linked cash exposure. GST ITC pending, TDS payable and receivable, advance tax due dates, and now, under the amended Ind AS 7, supplier finance arrangement exposure. This layer is critical given the increased investor scrutiny following recent regulatory changes.
A well-designed CFO dashboard, in essence, is a central repository of financial insight spanning net profit, revenue, current ratio, COGS, EBITDA, working capital, quick ratio and cash flow (specindia.com/live-bi-visualization/cfo-dashboard) — but for a cash-specific view, the four layers above should dominate the landing page, with everything else one click away.
How do GST and TDS quietly strangle your cash flow?
In India, tax compliance isn't a quarterly line item; it's a continuous cash flow event.
Start with GST. Used well, GST registration and input tax credit actually help SME cash flow — faster refunds and ITC offsets can materially improve working capital when the mechanics work smoothly (busy.in/blog/gst-benefits-for-indian-smes-and-startups). But when they don't, the damage is significant: GST-related delays can block 5–15% of an SME's working capital (pepagora.com/blog/simplified-gst-faster-refunds-2026-impact-on-sme-cash-flow-in-india), and over 60% of Indian SMEs report working capital stress tied directly to delayed payments and refunds (pepagora.com/blog/simplified-gst-faster-refunds-2026-impact-on-sme-cash-flow-in-india).
Worked example: a Pune-based auto-components manufacturer with ₹8 crore monthly turnover typically carries ₹35–40 lakh in unutilized ITC at any point because of mismatches between GSTR-2B and vendor filings. If your dashboard doesn't reconcile ITC claimed vs. ITC actually credited, that ₹35–40 lakh sits invisible — technically an asset, functionally dead cash.
TDS cuts the other way. Money is either deducted before it reaches your bank account, or you must set aside and deposit it after paying a vendor — either way, it's cash pressure, and credits often stay locked until ITR filing season (busy.in/blog/importance-of-tds-in-cash-flow-management-for-businesses).
TDS isn't a rounding error either — in FY 2024–25, TDS accounted for nearly a third of India's gross direct tax receipts (etcfo.com/news/100494793/budget-2026-expectations-how-simplifying-tds-can-improve-cash-flows-and-compliance), which tells you how structurally embedded it is in every payment cycle your business runs.
The newest wrinkle: Section 194T, effective April 1, 2025, mandates 10% TDS on partner remuneration, commission, bonus and interest above threshold for partnership firms and LLPs — a change that can create real cash-flow stress for MSMEs structured this way (busy.in/blog/importance-of-tds-in-cash-flow-management-for-businesses). If your firm is an LLP and your dashboard hasn't added a 194T tracking tile, you're flying blind on a brand-new cash outflow that didn't exist eighteen months ago.
Practical build note: create a dedicated "Tax Cash Impact" card showing (a) GST ITC claimed vs. credited vs. blocked, (b) TDS deducted-but-not-deposited liability, (c) TDS receivable pending certificate/ITR credit, and (d) lower/nil deduction certificate status by vendor. This single card, refreshed weekly from GSTR-2B and TDS ledger data, routinely surfaces "invisible" cash movement in mid-sized companies we've reviewed.
What has MCA changed — and does it apply to you?
Two MCA moves in 2025 directly touch how your cash flow dashboard should be designed, and they pull in opposite directions.
First, MCA amended Ind AS 7 (Statement of Cash Flows) effective April 1, 2025, requiring companies to disclose supplier finance arrangements — supply chain finance and reverse factoring — so investors get a clearer picture of leverage and liquidity (caalley.com/mca-tightens-supplier-finance-disclosures-from-fy26-cfos-to-face-higher-investor-scrutiny).
If your company uses vendor financing or reverse factoring through your bank to extend payment terms, you now need a dashboard tile tracking outstanding supplier finance balances, their maturity profile, and their true impact on your reported DPO — because auditors and investors are going to ask, and "let me check with the bank" is not an answer you want to give in a board meeting.
Second, and pulling the other way: MCA expanded the financial thresholds defining "Small Companies," effective December 1, 2025, and one consequence is that more companies now qualify for exemption from preparing a mandatory Cash Flow Statement under Section 134(1) of the Companies Act (parinamlaws.com/post/mca-expands-financial-thresholds-for-small-companies).
If your turnover and paid-up capital now fall under the revised thresholds, you may no longer be legally required to prepare one.
Here's the catch for growth-aspiring mid-sized firms: regulatory relief is not the same as management relief. A company that stops preparing a cash flow statement because it's now exempt is trading a compliance chore for a strategic blind spot — right at the moment it's trying to scale, raise debt, or attract investors who will still expect to see one. We'd argue the exemption is a reason to build an internal dashboard-driven cash flow view, not a reason to stop looking at cash flow altogether.
Why do Indian mid-sized companies keep running out of cash despite being profitable?
Because profit and cash are different animals, and the gap between them in India is wider than most P&L-literate finance teams expect. The most common failure modes we see, repeatedly:
- Delayed receivables. Delayed payments from customers are consistently flagged as the single biggest cash flow killer for small businesses in India, where net-30 and net-60 terms are standard but rarely honoured on schedule (jordensky.com/cash-flow-management-guide-india). Nearly 40% of small businesses report working capital stress primarily driven by delayed receivables (jordensky.com/cash-flow-management-guide-india).
- Weak forecasting discipline. Overlooking precise cash flow forecasting, failing to track unpaid invoices, and loose expense tracking are named as recurring, quietly fatal mistakes in Indian businesses (theceomagazine.in/business/9-cash-flow-mistakes-that-quietly-kill-profitable-businesses-in-india).
- Seasonal and payment-cycle mismatches. A distributor supplying to organized retail in Q3 (festive season) often extends 45–60 day credit to retailers while paying manufacturers on 15-day terms — a structural mismatch that a monthly P&L never reveals but a weekly cash dashboard exposes instantly.
This is the exact kind of exception that a well-designed dashboard is supposed to surface automatically, rather than something a controller stumbles on during a stressed month-end.
How do you actually build this in Power BI without it becoming shelfware?
Power BI is the right tool for most mid-sized Indian companies — it holds roughly 30–36% of the global BI market (analytics-benchmark.com/blog/how-many-companies-in-india-use-power-bi-market-adoption-data), and over 3,300 Indian companies publicly disclose using it, with the real number almost certainly higher since many don't disclose their stack at all (analytics-benchmark.com/blog/how-many-companies-in-india-use-power-bi-market-adoption-data). But owning the license is not the same as using it well: 84% of companies polled report Power BI adoption under 50%, meaning most of the investment sits unused (collectiv.com/blog/power-bi-adoption-stats). The tool isn't the bottleneck. Design and adoption discipline are.
A build sequence that actually sticks:
- Establish a single source of truth first. Pull bank feeds, Tally/SAP GL data, and GST/TDS ledgers into one data model before building a single visual. Skipping this step is why so many Power BI dashboards in India end up as prettier spreadsheets — same stale, unreconciled numbers, just with better colours.
- Automate reconciliation, not just reporting. Bank reconciliation and GST ITC mapping are exactly the kind of repetitive, error-prone tasks that real-time dashboards can automate, freeing up meaningful analyst time (myndsolutions.com/blog/real-time-financial-dashboards-indian-cfos). If your dashboard still requires someone to manually tie out bank balances every morning, you haven't automated anything — you've just visualized the manual work.
- Design for exceptions, not totals. A dashboard that shows "Total Receivables: ₹4.2 crore" is useless. One that flags "₹68 lakh crossing 90 days overdue, concentrated in 4 customers" is actionable. Build conditional formatting and drill-through paths around thresholds your treasury team actually cares about — not around what looks good in a screenshot.
- Refresh cadence matched to decision cadence. Bank balance: daily. Receivables/payables aging: daily or every 2 days. GST/TDS position: weekly. 13-week forecast: weekly, with a rolling variance-to-actual comparison.
- One page, one decision. Resist the urge to cram twelve KPIs onto the landing page. The CFO opening this at 8am needs exactly three things above the fold: today's cash position, this week's net inflow/outflow, and the top three exceptions requiring action.
We've covered the broader discipline of building dashboards finance teams actually trust — not just tolerate — in our piece on MIS reporting best practices; the same trust-building principles (data lineage, single source of truth, no silent overrides) apply doubly to cash flow, because the cost of a wrong number here isn't a bad-looking slide — it's a bounced payment.

What's the real ROI of getting this right?
Not "time saved building reports." That's the pitch consultants use when they can't quantify the actual business impact. The real ROI shows up in three places:
Reduced borrowing costs. A company that can see a receivables crunch three weeks out can draw down working capital financing selectively and cheaply, instead of scrambling for an emergency overdraft at a punitive rate. Even a 50-basis-point improvement in average borrowing cost on ₹5 crore of working capital debt is ₹2.5 lakh a year — directly attributable to better forecasting visibility.
Recovered "invisible" cash. Blocked ITC and pending TDS credits can represent significant amounts of cash. A dashboard that surfaces these monthly, rather than annually at audit time, means that cash gets actively chased and unlocked instead of quietly written off.
Fewer supplier relationship shocks. With Ind AS 7 now requiring supplier finance disclosure, and with UPI having become the backbone of India's payment rails — processing ₹29,90,424.21 crore across 23,201.93 million transactions in May 2026 alone, or 85% of the country's digital payments (etcfo.com/news/100516496/indias-finance-trends-in-2026-smarter-money-safer-markets-faster-payments) — payment expectations from both sides of your ledger have compressed dramatically. A vendor who sees UPI-speed settlement elsewhere has little patience for a 60-day payment cycle justified by "we're waiting on our own receivables." A dashboard that lets you manage both sides of that timing gap proactively protects supplier terms that took years to negotiate.
None of this requires an army of data engineers. It requires a CFO who insists the dashboard reflects how cash actually moves in an Indian business — GST, TDS, MCA disclosures, and delayed receivables included — rather than a generic template imported from a global template library. If you're also rethinking how automation fits into this picture more broadly, our comparison of AI versus traditional automation for mid-sized Indian finance functions is a useful next read before you scope the build.
How BiPivot helps
We build cash flow dashboards for mid-sized Indian companies that go beyond bank balance and receivables totals — modeling GST ITC, TDS exposure, and MCA-mandated supplier finance disclosures directly into the Power BI layer your CFO already trusts. If your current dashboard can't answer "can we pay Friday?" in under a minute, talk to us at BiPivot about a design review.