

P&L Dashboard Best Practices for Mid-Sized Indian Companies: From Month-End Autopsy to Real-Time Command Center
By BiPivot Team · 25 July 2026
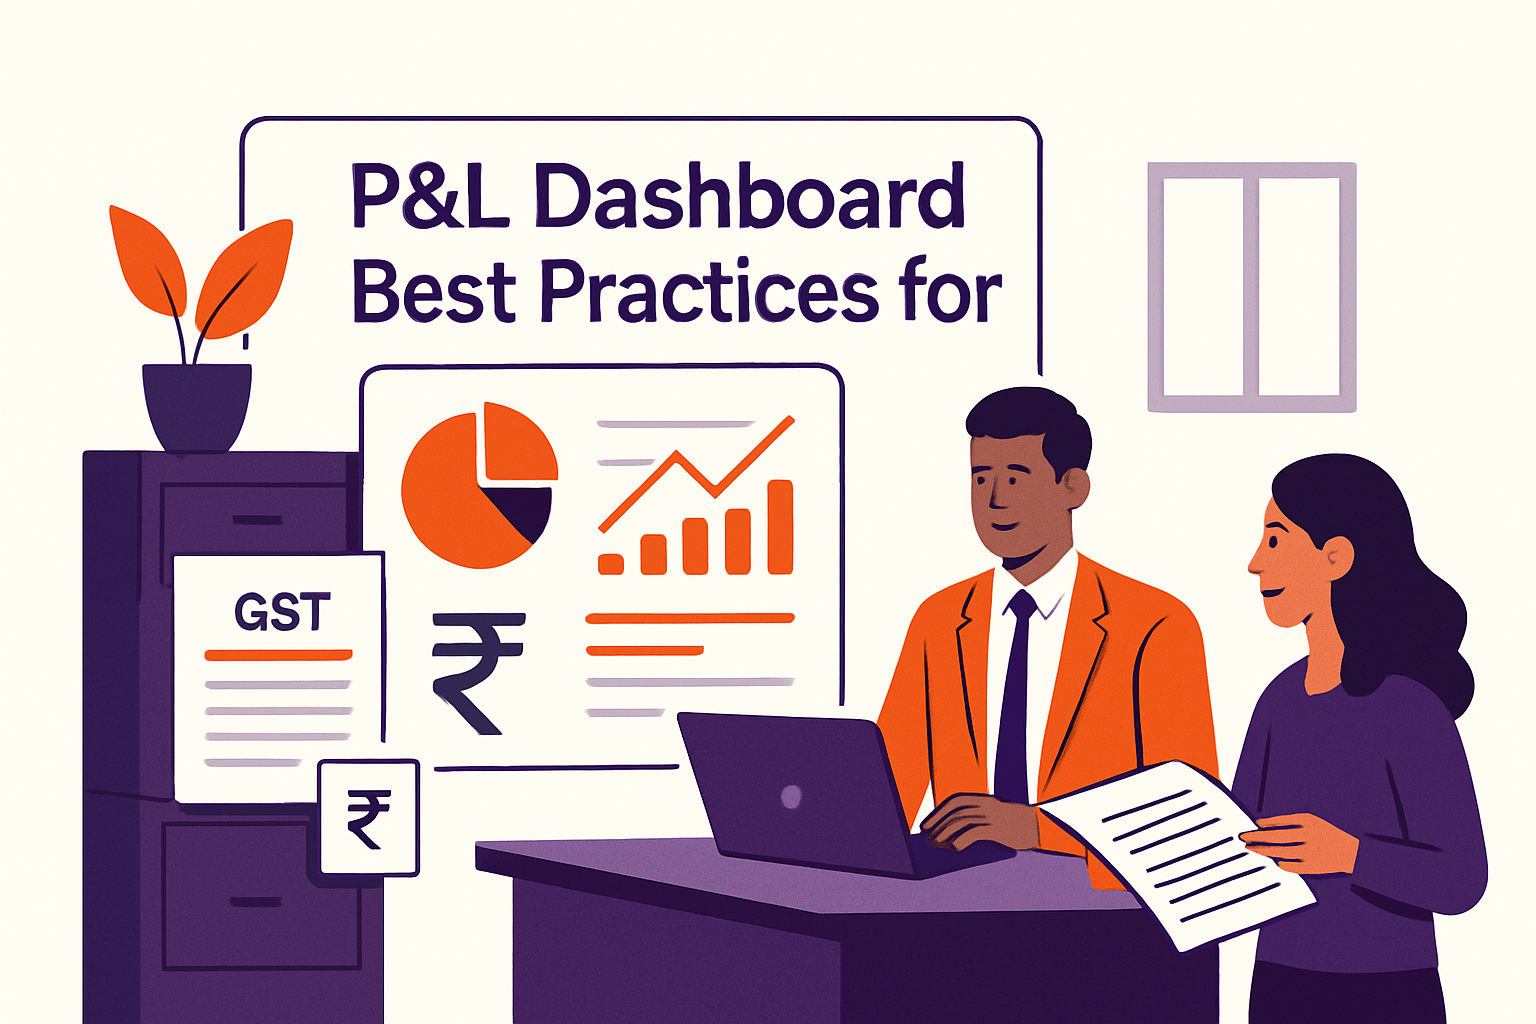
For many mid-sized Indian companies, P&L reporting often involves manual, error-prone spreadsheet-based processes, such as Tally exports dumped into Excel, leading to extensive hours spent on reconciliation and static, backward-looking reports. This approach means finance functions are often reactive scorekeepers rather than proactive strategic partners. A properly built Power BI P&L dashboard changes the sequence entirely: data flows in near real time, GST and TDS adjustments happen automatically, and the CFO spends time deciding instead of reconciling.
This article is a practical build guide, not a feature tour. It covers what actually goes wrong in Indian finance teams building P&L dashboards, and the specific design choices that fix it.
Why isn't your current P&L reporting fast enough?
If your monthly MIS still takes a week to close, you're not alone — and the cost is measurable. Manual MIS preparation can consume 60–150 hours per month for a CA firm handling 30 clients, and a CFO at a single mid-sized company routinely loses 1–2 full working days every month just assembling numbers before any analysis even starts source.
Think about what that actually means for a ₹150 crore-turnover manufacturer with three plants and a distributor network across four states. Every month-end, the accounts team pulls Tally ledgers plant-wise, someone maps cost centers manually in Excel, someone else reconciles GST input credit against GSTR-2B, and a fourth person nets off TDS receivable against advance tax. By the time the consolidated P&L reaches the CFO's desk, it's often the 12th or 15th of the following month. A pricing correction that should have happened on day 3 happens on day 20 — and that lag compounds across every SKU and region.
The fix isn't "work faster in Excel." It's re-architecting the pipeline so Power BI pulls transaction-level data directly from Tally/SAP, GST filings, and bank feeds, and the P&L refreshes on a schedule (daily or even intraday) rather than being manually rebuilt every month. This is precisely why companies leveraging real-time analytics report a 29% improvement in decision-making speed and a 21% reduction in operational costs source. A dashboard that just replicates last month's static report in a fancier layout doesn't earn its keep — it needs to shrink the decision lag.
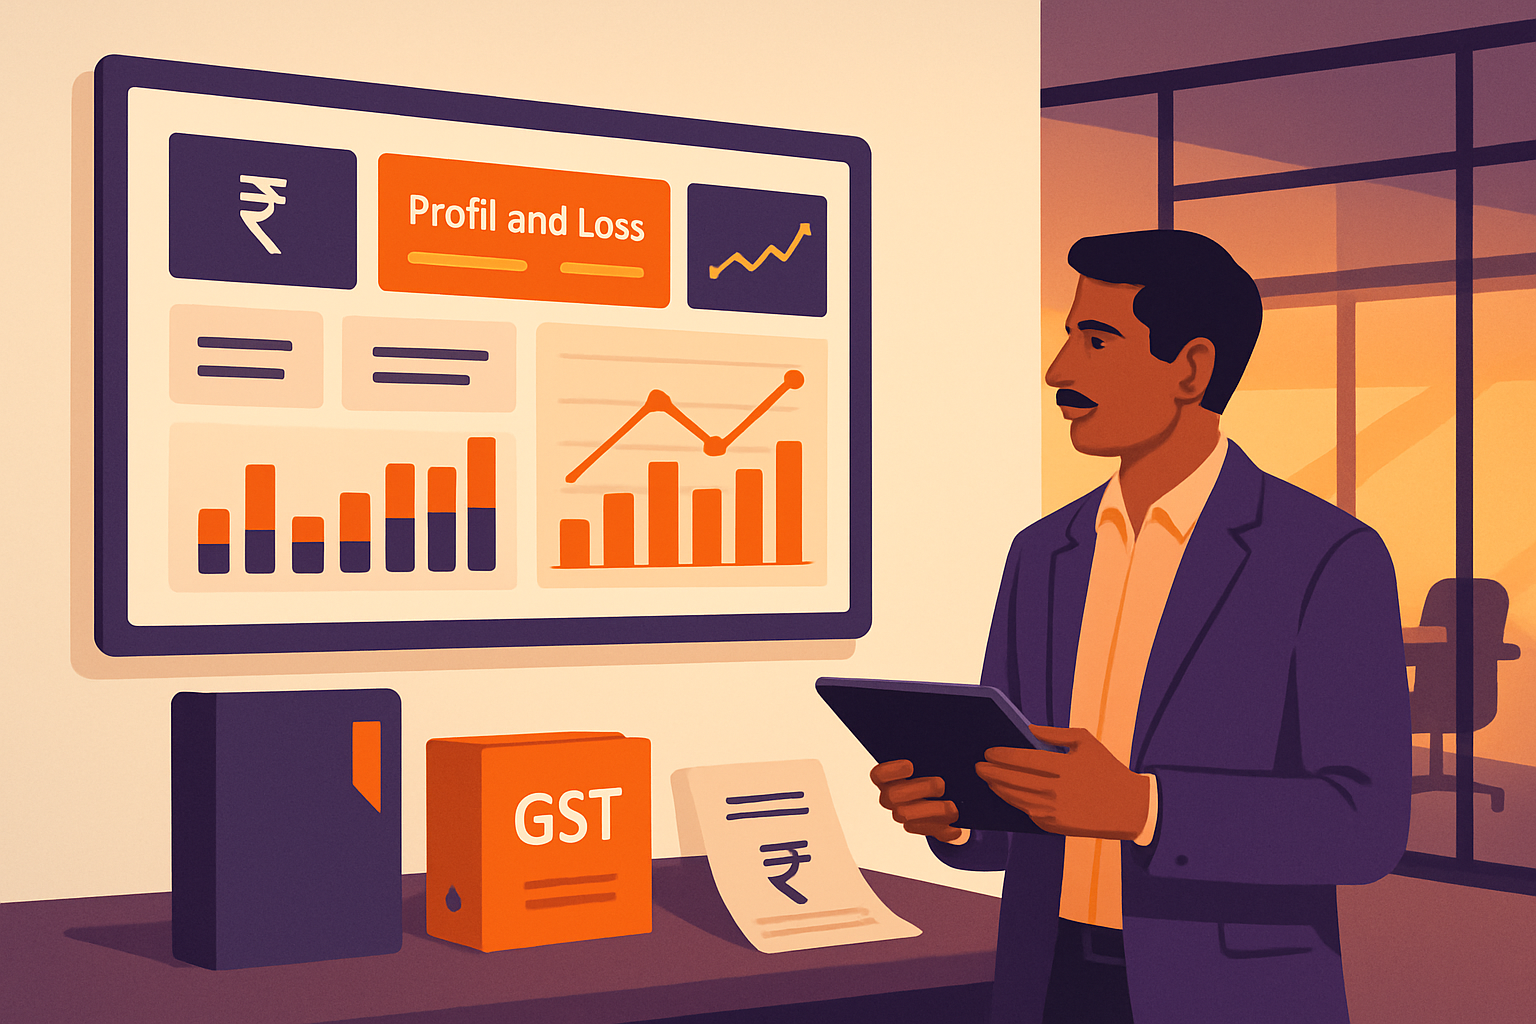
What does an Indian P&L dashboard need that a generic template doesn't?
Most Power BI templates you'll find online are built for US or European GAAP reporting. They break at the first Indian complication — usually GST. Three adjustments are non-negotiable for a dashboard that finance and auditors will both trust:
1. Revenue must be net of GST, not gross. If your invoicing system records the gross invoice value in the transaction table, your "Revenue" measure in Power BI needs an explicit DAX calculation to strip out CGST/SGST/IGST components before it hits the top line. Get this wrong once and your gross margin percentages are permanently overstated — a mistake that's embarrassing in a board deck and worse in front of an auditor.
2. Input tax credit (ITC) needs its own reconciliation layer. Your dashboard should show ITC claimed, ITC matched against GSTR-2B, and ITC at risk of reversal, sitting alongside the expense lines they relate to — not buried in a separate GST compliance workbook nobody in the finance-strategy meeting ever opens.
3. TDS deducted and TDS receivable need to reconcile against Form 26AS, not just sit as a plug in "other current assets." A dashboard that surfaces TDS mismatches monthly (rather than at year-end tax audit time) saves genuine cash — mismatched TDS credits are one of the most common reasons refunds get stuck for months.
Getting revenue, ITC, and TDS treatment right is what separates a dashboard finance can defend in an audit from one that just looks good in a demo source.
There's also a compliance-scale reason this matters now more than ever: the GST e-invoicing threshold dropped to ₹1 crore turnover from April 2025, which pulled lakhs of additional small and mid-sized businesses into mandatory e-invoicing source. If your dashboard doesn't already pull structured e-invoice data, this is the year to build that pipe — it's a cleaner, more granular data source than manual invoice entry ever was.
How do you actually connect Tally, SAP, and your P&L data without more manual work?
Data silos are the single biggest reason P&L dashboards fail after month two. The build looks great in the pilot, then someone in the sales team keeps updating their own Excel-based revenue tracker, the warehouse team's dispatch data lives in a separate system, and within a quarter the "single source of truth" dashboard is quietly ignored because it doesn't match what people already trust.
Integrating data from disparate systems — ERPs, accounting platforms, CRMs — into one unified model is what actually breaks these silos down source. In practice, for a typical mid-sized Indian company, that means:
1. Tally/SAP Business One → Power BI direct connector or ODBC, refreshing at least daily, pulling ledger-level entries with cost center and GST tags intact. 2. Bank statement feeds (via API where the bank supports it, or a scheduled CSV import otherwise) to reconcile actual cash against booked revenue and expenses. 3. CRM or sales order data to segment revenue by customer, product, and channel before it becomes a single "Sales" line in the P&L. 4. A common master data layer — one chart of accounts mapping, one cost-center hierarchy, one customer master — so that a "Region" filter behaves identically whether you're looking at revenue, COGS, or overheads.
This last point is where most builds quietly collapse. If sales data tags regions as "North/South/East/West" and the accounting system tags plants as "Delhi/Chennai/Kolkata/Mumbai," your dashboard can't cross-filter cleanly, and someone ends up manually mapping it in Excel again — defeating the entire purpose.
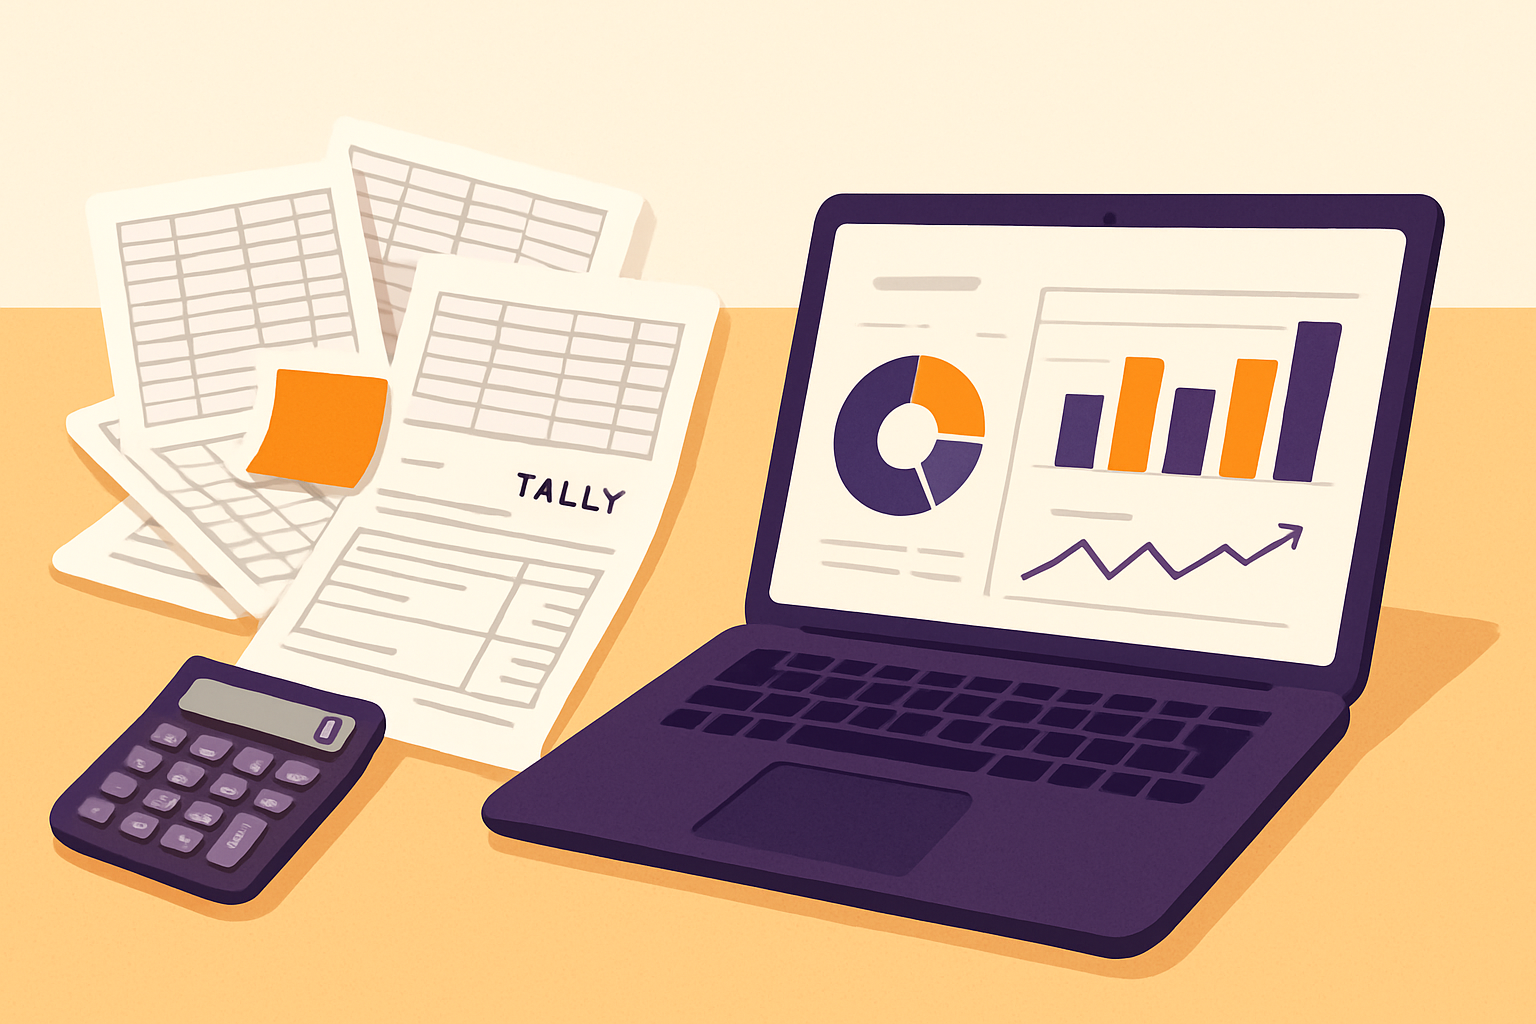
Which metrics actually belong on a CFO's P&L dashboard — and which don't?
A P&L dashboard that tries to show everything shows nothing usefully. The best-practice principle is to focus on high-impact metrics, tailor views for the specific audience, provide context (not just numbers), and let users drill down without cluttering the top view source.
For a mid-sized Indian company's board-facing page, the top layer should be tight:
- Net revenue (GST-excluded) — current month vs. budget vs. same month last year
- Gross margin % — with a one-click toggle to see it by product line
- EBITDA and EBITDA margin — the number every lender and PE investor actually asks about first
- Working capital days — DSO, DPO, and inventory days, since Indian B2B trade runs heavily on credit and this is where cash actually leaks
- Cash conversion vs. reported profit — a company can show 15% net margin on paper and still be cash-starved if receivables are stretching past 90 days
Below that top layer, the drill-down should let a plant controller or regional sales head go from "consolidated EBITDA fell 2 points" straight down to "Chennai plant's power cost per unit rose 18% this quarter" without switching tools. That's the real value of granular, segmented profitability — by product, channel, customer type, region, and cost center — because it turns a lagging indicator into an actionable one source.
Worked example: Say a Pune-based auto components manufacturer reports consolidated revenue of ₹42 crore for Q1 FY27, with a blended gross margin of 24%. That single number tells the CFO nothing about where to act. Segmented by customer, the dashboard shows OEM contracts running at 19% margin (high volume, price-locked) while aftermarket/replacement sales run at 34% margin but only 22% of volume. The strategic lever is obvious once you see the split: push the sales team to grow aftermarket share even by 5 percentage points, and blended margin moves meaningfully without touching a single OEM price negotiation. That insight is invisible in a consolidated P&L and glaringly obvious in a segmented one.

How do you keep the dashboard from becoming a compliance liability?
Two regulatory realities need to sit inside your dashboard design from day one, not bolted on later.
MCA annual filings. Every private and public company in India files financial statements via Form AOC-4 and annual returns via Form MGT-7, both of which rely on accurate, audited P&L data source. If your monthly dashboard already reconciles cleanly to the trial balance format your statutory auditor expects, year-end AOC-4 preparation shrinks from a multi-week scramble to a formality — because the data has already been validated twelve times over the year instead of once in a rush during audit season.
Ind AS 118, effective April 1, 2027. This is the one most finance teams haven't started planning for. Ind AS 118 will overhaul how P&L statements are presented, introducing structured categories (operating, investing, financing) and mandatory new subtotals that don't currently exist in most Indian P&L formats source.
Practically, that means the dashboard you're building in 2026 should already separate P&L line items into these three categories at the data-model level, even if today's statutory format doesn't require it. Retrofitting a rigid, hard-coded Power BI report to a new statutory structure 18 months from now is painful; designing the underlying model to be category-flexible now costs almost nothing extra. This is a one-time architectural decision — get it into your data model this year and the transition in 2027 becomes a formatting exercise, not a rebuild.
Why does Power BI keep winning this particular fight — and where does adoption usually stall?
Power BI's dominance in this space isn't accidental. Globally it holds 30–36% of the business intelligence market and is used by over 30 million people monthly source. In India specifically, over 3,300 companies publicly disclose using Power BI — and given how many organizations don't disclose their stack at all, the real number is far higher source. It's also why 65% of Indian enterprises now call BI tools essential to operational efficiency source. The core capabilities — turning messy transactional data into clear visuals, customizable views per role, AI-assisted anomaly detection, and connectors to hundreds of source systems — are exactly what a fragmented Indian finance stack (Tally + Excel + bank portal + GST portal + a CRM) needs source.
But here's the uncomfortable stat that most vendor pitches skip: only 16% of companies achieve 100% Power BI adoption, and 84% report adoption under 50% source. The gap almost never comes down to the tool. It comes down to three things: dashboards that were built by IT without finance in the room (so the metrics don't match how the CFO actually thinks about margin), refresh schedules that lag so far behind that the "live" dashboard is quietly abandoned for the trusted Excel workbook, and a lack of one designated owner responsible for keeping the data model accurate as the chart of accounts evolves.
If you're auditing your own rollout, ask honestly: who opens this dashboard without being reminded to, and how often? If the answer is "only during the monthly review meeting," the build hasn't earned trust yet.
How does a P&L dashboard change what the finance team actually does day to day?
The deeper shift a good P&L dashboard enables isn't cosmetic — it changes what finance is for. Once revenue, margin, and cash visibility update daily instead of monthly, finance stops being the department that reports what already happened and starts being the department flagging what's about to happen: a customer sliding past 60-day payment terms, a raw material cost creeping up before it hits the P&L in bulk next quarter, a product line's margin quietly eroding two months before anyone notices in the consolidated view.
This is the same directional shift covered from a controls angle in our piece on AI for Internal Audit: Practical Use Cases for Mid-Sized Indian Companies — that article looks at using AI to catch anomalies and compliance gaps proactively; this one is about using the same real-time data infrastructure to drive commercial and pricing decisions, not just control risk. Both rely on the identical underlying discipline: get transactional data into a clean, automated pipeline instead of a monthly manual reconciliation, and everything downstream — audit, strategy, pricing — gets faster and more reliable.
A well-designed dashboard also changes the finance team's own time allocation. Time that used to go into rebuilding pivot tables every month goes instead into scenario modeling — "what happens to EBITDA if input costs rise 6% and we can only pass through 3% in price" — which is the kind of analysis that gets a CFO invited into strategy conversations rather than just budget-approval ones.
What's the realistic first build to attempt?
Don't try to build the perfect enterprise-grade P&L dashboard in one shot. Start with a 4-week scoped build:
1. Week 1: Connect Tally/ERP ledger data and bank feed to Power BI; build the GST-net revenue and ITC reconciliation logic first, since this is where most errors hide. 2. Week 2: Build the consolidated P&L page (revenue, gross margin, EBITDA, working capital days) with month/budget/prior-year comparisons. 3. Week 3: Add segmentation — product, region, customer, cost center — with drill-through, and structure the data model into operating/investing/financing categories to stay Ind AS 118-ready. 4. Week 4: Pilot with 3-4 actual users (CFO, controller, one regional head), fix what they don't trust, and only then roll out wider.
Skipping straight to a company-wide rollout before this pilot stage is the single most common reason adoption stalls at the 30-40% mark referenced above.
How BiPivot helps
BiPivot builds Power BI P&L dashboards specifically for mid-sized Indian companies — wired directly into Tally/SAP, GST, and TDS data so the numbers reconcile the first time, not after three rounds of manual correction. If your team is still losing days each month to spreadsheet reconciliation, talk to us at bipivot.com about a scoped pilot build on your own data.